Feedback Case Study
Introduction
This case study demonstrates our system’s ability to do real-time feedback from the experiment using triggers. We show how information from the experiment may be used to extend the Orchestrator autonomy and deterministically control dynamic experiments. This is an example where the active state of an experiment is a driving input to the control. The data management layer too plays an important role in enabling the flow of information.
In this case study we show how, in a semi-controllable environment, the amount of traffic on a given link may be controlled using feedback from the experiment itself. The traffic on one of the links in the experiment must be maintained within a certain range; for this example, the range was 100-105 MB. We assume that the uncontrollable traffic on the link would not exceed the required maximum.
This experiment is set up with the following characteristics:
- the monitored link has some noise (uncontrollable traffic) flowing through it.
- The noise has been artificially generated.
- We set the noise generating clients to pull randomly changing amount of traffic from the servers, in order to enact the noise.
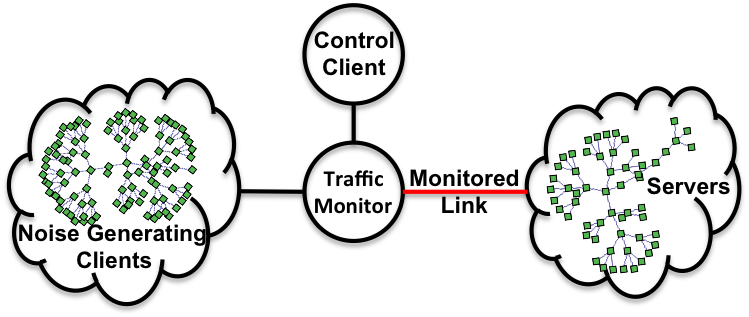
The solution is not dependent on the experiment topology. We deploy a traffic monitor agent on one of the end nodes of the link to be monitored. The traffic monitoring agent continuously monitors the traffic on the link. We also deploy a traffic generator agent (control client) that coordinates with the traffic monitor agent in real time and generates exactly the amount of traffic that would help maintain the total traffic on the link within the required limits.
To demonstrate this case study, we set up an experiment topology similar to the one seen in the following figure, with 50 noise generating clients and 10 servers. We also tested a scaled up version of the experiment with 300 noise generating agents and 100 servers. However, due to the resource constraints on the testbed, we recommend you try this case with the smaller topology first. The scaling up of the experiment may be achieved with very simple modifications.

We use two kinds of agents:
- A server agent (located on the server nodes) that runs an apache server and serves random data of requested size.
- A client agent (located on the client nodes) that periodically requests data from a randomally chosen server agent. The size of data that a client agent requests is configurable. The initial configuration is set to ~1.2 MB for each of the 50 noise generating clients, and ~40 MB for the control client, adding up to a total of ~100 MB.
Now, to synthetically generate uncontrollable traffic, the size of data requested by the noise generating clients is changed randomly. We set the probability of change as: 80% - no change, 10% - increment, and 10% - reduction. The amount by which the fetch size is changed is calculated randomly.
Then, to add control to this experiment, specifically on the traffic on the monitored link, we add a traffic monitor and a traffic generator (control client). We deploy a traffic monitor agent on the client-side end node of the link to be monitored. This agent continuously monitors all the traffic flowing through the node. Further, we attach a node (control client) to the traffic generator, and deploy a client agent on it.
The Orchestrator, based on the real time traffic feedback, sends change load messages to the control client agent, in order to maintain the total traffic on the monitored link within the set limits. Event Streams
This example has six events streams; the server stream, the noise stream, the noise modify stream, the control client stream, the control stream and the duration stream.
Mapping to the Topology
The groups directive in the AAL file allows mapping a agent behavior to one or more nodes.
#!php
groups:
   server_group: &slist [s-0, s-1, s-2, s-3, s-4, s-5, s-6, s-7, s-8, s-9]
   noise_group: [uc-0, uc-1, uc-2, uc-3, uc-4, uc-5, uc-6, uc-7, uc-8, uc-9, uc-10,
                     uc-11, uc-12, uc-13, uc-14, uc-15, uc-16, uc-17, uc-18, uc-19, uc-20,
                     uc-21, uc-22, uc-23, uc-24, uc-25, uc-26, uc-27, uc-28, uc-29, uc-30,
                     uc-31, uc-32, uc-33, uc-34, uc-35, uc-36, uc-37, uc-38, uc-39, uc-40,
                     uc-41, uc-42, uc-43, uc-44, uc-45, uc-46, uc-47, uc-48, uc-49]
   sensor_group: [rc]
   client_group: [c-0]
In this example, we observe that there are four groups server_group, noise_group, sensor_group and client_group. The server_group consists of 10 servers. The noise_group consists of 50 noise generating clients. The sensor_group consists of the lone sensor node and the client_group consists of the controlling client. Additionally,we use yaml pointers to annotate the server_group as “slist”. The slist annotation is used to refer to the list of servers for configuring the client agents in the section below. Configuring the Agents
There are four types of agents, server_agent, noise_agent, monitor_agent, and client_agent.
Each of the server agent is used to start a web server serving garbage data of requested size. The noise agents are used to create the noise of the network. Each of the noise agent periodically fetches data of a randomally changing size from a ramdonly chosen server.
server_agent:
  group: server_group
  path: /share/magi/modules/apache/apache.tar.gz
  execargs: []

noise_agent:
  group: noise_group
  path: /share/magi/modules/http_client/http_client.tar.gz
  execargs: {servers: *slist, interval: '2', sizes: '120000'}

monitor_agent:
  group: sensor_group
  path: /proj/montage/modules/pktcounters/pktCountersAgent.tar.gz
  execargs: {}

client_agent:
  group: client_group
  path: /share/magi/modules/http_client/http_client.tar.gz
  execargs: {servers: *slist, interval: '2', sizes: '4000000'}
Server Stream
The server event stream consists of three states. The start state which generates a trigger, called serverStarted, once all the server agents are activated on the experiment nodes.
It then enters the wait state where it waits for a trigger from the noise stream and the client event stream.
Once the trigger is received, it enters the stop state, where the server is deactivated or terminated. Noise Stream and Control Client Stream
The noise and client event streams consists of five states. First, the agent implementation is parameterized by the configuration state. This occurs as part of the agent loading process on all the agent nodes.
The streams then synchronize with the server stream by waiting for the serverStarted trigger from the server nodes. Once they receive the trigger the agents are activated in the start state. Each agent fetches web pages from one of the listed servers.
Next, the streams wait for the monitorStopped trigger from the monitorstream. Once the trigger is received the clients are instructed to stop fetching data.
On termination, the agents sends a noiseStopped/clientStopped trigger that allows the server stream to synchronize and terminate the servers, which is done only after all the http client agents have terminated. Noise Modify Stream
The noise modify stream starts once the noise generating agents start. It continously instructs the noise generating agents to randomly modify the amount of noise being generated. This is done to create an uncontrolled noise generation behaviour. Control Stream
The control stream starts once the control client agent has started. It configures the traffic monitoring agent and instucts it to start monitoring. Once the monitoring starts, this stream continously monitors the amount of traffic flowing on the monitored link, and based on the traffic information, instructs the control client to modify the amount of traffic it is pulling, in order to maintain the total traffic on the monitored link within the required limits. Duration Stream
The duration stream manages the time duration for which the experiment needs to run. Its starts once the monitor agent has started. The stream then waits for ∆t before instructing the monitor agent stop and terminating all of the agents.
Running the Experiment
Step 1: Set up your environment
Set up your environment. Assuming your experiment is named myExp, your DETER project is myProj, and the AAL file is called procedure.aal.
PROJ=myExp
EXP=myProj
AAL=procedure.aal
Step 2: Set Up Containerized Experiment
As this experiment requires a lot of nodes, we should try and use containerized nodes. Create a containerized version of the experiment using this network description file: casestudy_feedback.tcl
NS=fb_topology.tcl

> /share/containers/containerize.py $PROJ $EXP $NS --packing=8 --openvz-diskspace 15G --pnode-type MicroCloud,pc2133
Step 3: Swap in your Experiment
Swap in the newly created experiment.
Step 4: Run Orchestrator
Once the experiment is swapped in, run the Orchestrator, giving it this AAL: casestudy_feedback.aal, the experiment name and project name.
> /share/magi/current/magi_orchestrator.py --experiment $EXP --project $PROJ --events $AAL
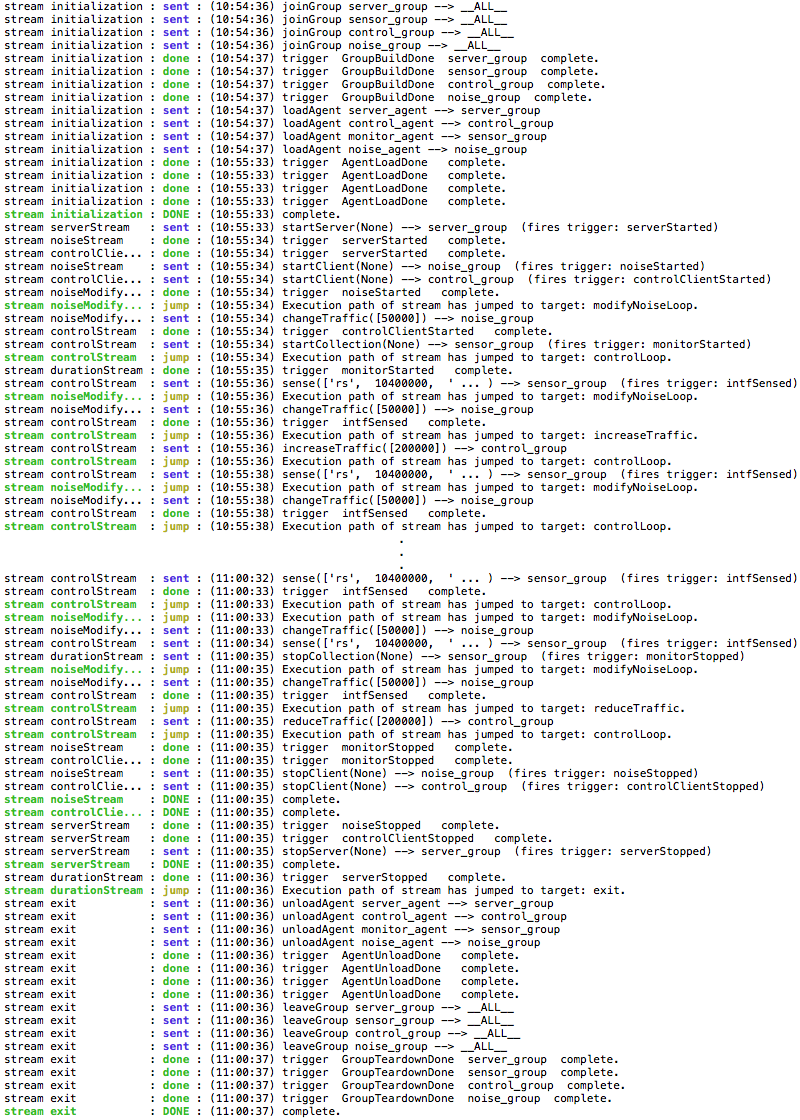
Once run, you will see the orchestrator step through the events in the AAL file. The example output below uses the project “montage” with experiment “caseFeedback”:

- The Orchestrator enacts an internally defined stream called initialization that is responsible for establishing all the groups and loading the agents. Once the agents are loaded, as indicated by the received trigger
AgentLoadDone, the initialization stream is complete. - Now all of the six above mentioned streams start concurrently.
- The serverstream sends the startServer event to the server_group. All members of the server_group start the server and fire a trigger serverStarted.
- The noiseStream and the controlClientStream on receiving the trigger serverStarted from the server_group, send the startClient event to the noise_group and the control_group, respectively. All memebers of both the groups start http clients and fire noiseStarted and controlClientStarted triggers.
- The noiseModifyStream on receiving the noiseStarted trigger joins a loop that sends a changeTraffic event to the noise_group, every two seconds.
- The control stream on receiving the controlClientStarted trigger sends a startCollection event to the monitor_group. The lone member of the monitor_group starts monitoring the interfaces on the node, and fires a monitorStarted trigger. The control stream then, joins a loop that sends a sense event to the monitor_group, every two seconds, and based on the return value in the response trigger intfSensed, sends a increaseTraffic or a reduceTraffic event to the control_group, if required.
- The duration stream after receiving the monitorStarted trigger, waits for 5 minutes. On completion, it sends a stopCollection event to the monitor_group. The monitor agent stop monitoring and sends back a monitorStopped trigger.
- Once the noiseStream and the controlClientStream recieve the monitorStopped trigger, they send out the stopClient event to their respective members. The http clients are stopped on all the members, and the noiseStopped and the controlClientStopped triggers are sent back to the orchestrator.
- The serverStream, on receiving the noiseStopped and the controlClientStopped triggers, sends out the stopServer event on the server_group. Once all the servers are stopped, the members of the server_group respond with a serverStopped trigger, which is forwarded to the durationStream.
- On receiving the serverStopped trigger, the durationStream enacts an internally define stream called exit that is responsible for unloading agents and tearing down the groups.
The experiment artifacts, the procedure and topology file that were used for the casestudy are attached below. Additionally, we have attached a detailed orchestration log that lists triggers from the clientnodes and the servernodes in the experiment.
- Procedure: casestudy_feedback.aal
- Topology: casestudy_feedback.tcl
- Archive Logs: casestudy_feedback.tar.gz
- Orchestration: casestudy_feedback.orch.log
Visualizing Experiment Results
Offline: A traffic plot may be generated using the MAGI Graph Creation Tool.
You can find the database config node for your experiment by reading your experiment’s configuration file, similar to the following.
  > cat /proj/myProject/exp/myExperiment/experiment.conf

  dbdl:
    configHost: node-1

  expdl:
    experimentName: myExperiment
    projectName: myProject
Then edit the simulated traffic plot URL, passing it the hostname.
  host=node-1.myExperiment.myProject

  http://<web-host>/traffic.html?host=node-1.myExperiment.myProject